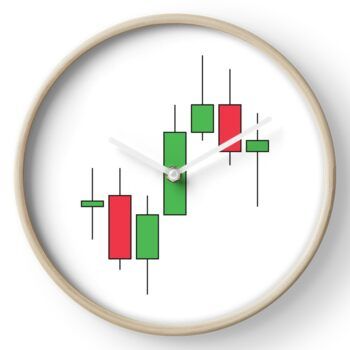
In the dynamic world of financial markets, understanding candlestick patterns is crucial for making informed trading decisions. Among the various candlestick patterns, Separating Lines stand out as a continuation pattern that traders use to predict market direction. This pattern consists of two candles with opposing colors but sharing the same opening price. Separating Lines can be either bullish or bearish, providing insights into the continuation of existing trends. In this article, we will delve into the structure, significance, and application of Separating Lines, enhancing your ability to interpret market movements effectively.
What Are Separating Lines?
Separating Lines is a continuation pattern observed on candlestick charts, characterized by two candles of opposite colors that open at the same price level. This pattern can signal the ongoing strength of the prevailing trend, whether bullish or bearish. Understanding the nuances of this pattern allows traders to anticipate potential market moves and make strategic decisions.

Types of Separating Lines
There are two primary types of Separating Lines: Bullish Separating Lines and Bearish Separating Lines. Each type reflects different market conditions and offers insights into the likely direction of the trend.
Bullish Separating Lines
- Pattern Structure: The first candle is bearish, followed by a bullish candle.
- Characteristics: The opening price of the first bearish candle matches or is close to the opening price of the preceding bearish candle. The second bullish candle closes higher than the previous day’s close.
- Significance: Bullish Separating Lines suggest that the bulls have regained control, signaling a potential continuation of the upward trend.
Bearish Separating Lines
- Pattern Structure: The first candle is bullish, followed by a bearish candle.
- Characteristics: The opening price of the first bullish candle is the same or close to the opening price of the preceding bullish candle. The second bearish candle closes lower than the previous day’s close.
- Significance: Bearish Separating Lines indicate that the bears are dominant, hinting at a possible continuation of the downward trend.

Analyzing the Strength of Separating Lines
Not all Separating Lines are created equal. The strength of this pattern can vary based on several factors, which traders must consider when analyzing its implications for market direction.
Trend Duration
- Longer Trends: The longer the trend that precedes the appearance of Separating Lines, the stronger the pattern’s signal.
- Shorter Trends: If the trend is relatively short, the Separating Lines may be less reliable as an indicator of continuation.
Candle Body Length
- Longer Bodies: Longer candle bodies in both the first and second candles typically suggest a stronger Separating Line pattern.
- Shorter Bodies: Shorter bodies may indicate indecision in the market, weakening the pattern’s significance.
Volume Considerations
- Volume of the First Candle: A smaller volume on the first candle followed by a larger volume on the second candle strengthens the Separating Line pattern.
- Volume of the Second Candle: Increased volume on the second candle often confirms the market’s conviction, enhancing the reliability of the pattern.
Key Technical Levels
- Support and Resistance: The strength of Separating Lines is magnified when they appear near critical support or resistance levels.
- Breakout Points: If Separating Lines form at a technical breakout point, they may signal a significant continuation of the trend.
Speed of Price Movement
- Slow to Rapid Movement: A slow rise or fall in the first candle followed by a rapid movement in the second candle typically indicates a stronger pattern.
- Consistent Movement: Consistent movement without acceleration may suggest a weaker Separating Line.

Technical Indicators to Use with Separating Lines
While Separating Lines offer valuable insights on their own, combining them with other technical indicators can provide a more comprehensive analysis. Here are some commonly used technical indicators that complement Separating Lines.
Moving Average (MA)
Moving averages smooth out price data to help identify the direction of the trend. When Separating Lines appear near a moving average, traders can analyze their relationship with the moving average to confirm trend continuation.
Relative Strength Index (RSI)
RSI measures the speed and change of price movements and helps identify overbought or oversold conditions. By observing whether Separating Lines occur in these zones, traders can gauge the potential strength of the continuation pattern.
Stochastic Oscillator (KDJ)
The KDJ indicator identifies potential reversal points in a trend. When Separating Lines align with overbought or oversold conditions as indicated by the KDJ, it can strengthen the pattern’s reliability.
Average True Range (ATR)
ATR measures market volatility. If Separating Lines form during periods of high ATR, it suggests a strong trend continuation, whereas low ATR might indicate a weakening trend.
Volume Indicators
Volume is a key factor in validating the Separating Lines pattern. Higher volume on the second candle typically confirms the pattern, indicating strong market participation and enhancing the pattern’s reliability.

Practical Applications of Separating Lines in Trading
Understanding the structure and significance of Separating Lines is just the beginning. Traders can apply this knowledge in various trading strategies to capitalize on market trends.
Confirming Trend Continuation
Separating Lines are particularly useful in confirming the continuation of a trend. For example, in an uptrend, the appearance of Bullish Separating Lines can reinforce the trader’s confidence in maintaining long positions.
Timing Entry and Exit Points
Traders can use Separating Lines to time their entry and exit points more effectively. For instance, after identifying a Bearish Separating Line in a downtrend, a trader might decide to enter a short position or add to an existing one.
Risk Management
Incorporating Separating Lines into a broader risk management strategy can help traders make informed decisions about stop-loss placements. For example, setting a stop-loss just above the second candle in a Bearish Separating Line pattern can help minimize potential losses.
Combining with Other Patterns
Separating Lines can be combined with other candlestick patterns and technical indicators to create a more robust trading strategy. For instance, confirming a Separating Line with a moving average crossover can increase the reliability of the signal.

Limitations of Separating Lines
While Separating Lines are valuable tools for traders, they are not without limitations. Understanding these limitations can help traders use this pattern more effectively.
Not a Standalone Indicator
Separating Lines should not be used in isolation. They are most effective when combined with other technical indicators or patterns to confirm the trend continuation.
False Signals
Like all technical patterns, Separating Lines can produce false signals, especially in volatile or choppy markets. Traders should be cautious and seek additional confirmation before making trading decisions based on this pattern.
Requires Context
The effectiveness of Separating Lines depends heavily on the context in which they appear. Factors such as the overall market trend, volume, and key support and resistance levels must be considered to accurately interpret the pattern.

FAQs
What are Separating Lines in candlestick charts?
Separating Lines is a continuation pattern on candlestick charts consisting of two candles of opposite colors that open at the same price level. This pattern indicates the continuation of the current trend.
What is the difference between Bullish and Bearish Separating Lines?
Bullish Separating Lines feature a bearish candle followed by a bullish candle, indicating a continuation of an uptrend. Bearish Separating Lines feature a bullish candle followed by a bearish candle, signaling a continuation of a downtrend.
How can I identify a strong Separating Line pattern?
A strong Separating Line pattern typically features long candle bodies, significant volume on the second candle, and appears near key technical levels such as support, resistance, or moving averages.
Can Separating Lines be used in all market conditions?
While Separating Lines can be observed in various market conditions, they are most reliable in trending markets. In volatile or sideways markets, the pattern may produce false signals.
What are some technical indicators that can be used with Separating Lines?
Moving averages, RSI, Stochastic Oscillator (KDJ), Average True Range (ATR), and volume indicators are commonly used with Separating Lines to confirm the strength and validity of the pattern.
Are Separating Lines a reliable trading signal?
Separating Lines can be a reliable signal when combined with other technical analysis tools and used in the context of the overall market trend. However, like all patterns, they are not foolproof and should be used with caution.
Separating Lines is a powerful candlestick pattern that can provide traders with valuable insights into market trends. By understanding the structure and significance of Bullish and Bearish Separating Lines, traders can better anticipate trend continuations and make more informed trading decisions. However, it is essential to consider this pattern in conjunction with other technical indicators and market conditions to enhance its effectiveness. As with any trading tool, practice and experience are key to mastering the use of Separating Lines in your trading strategy.


